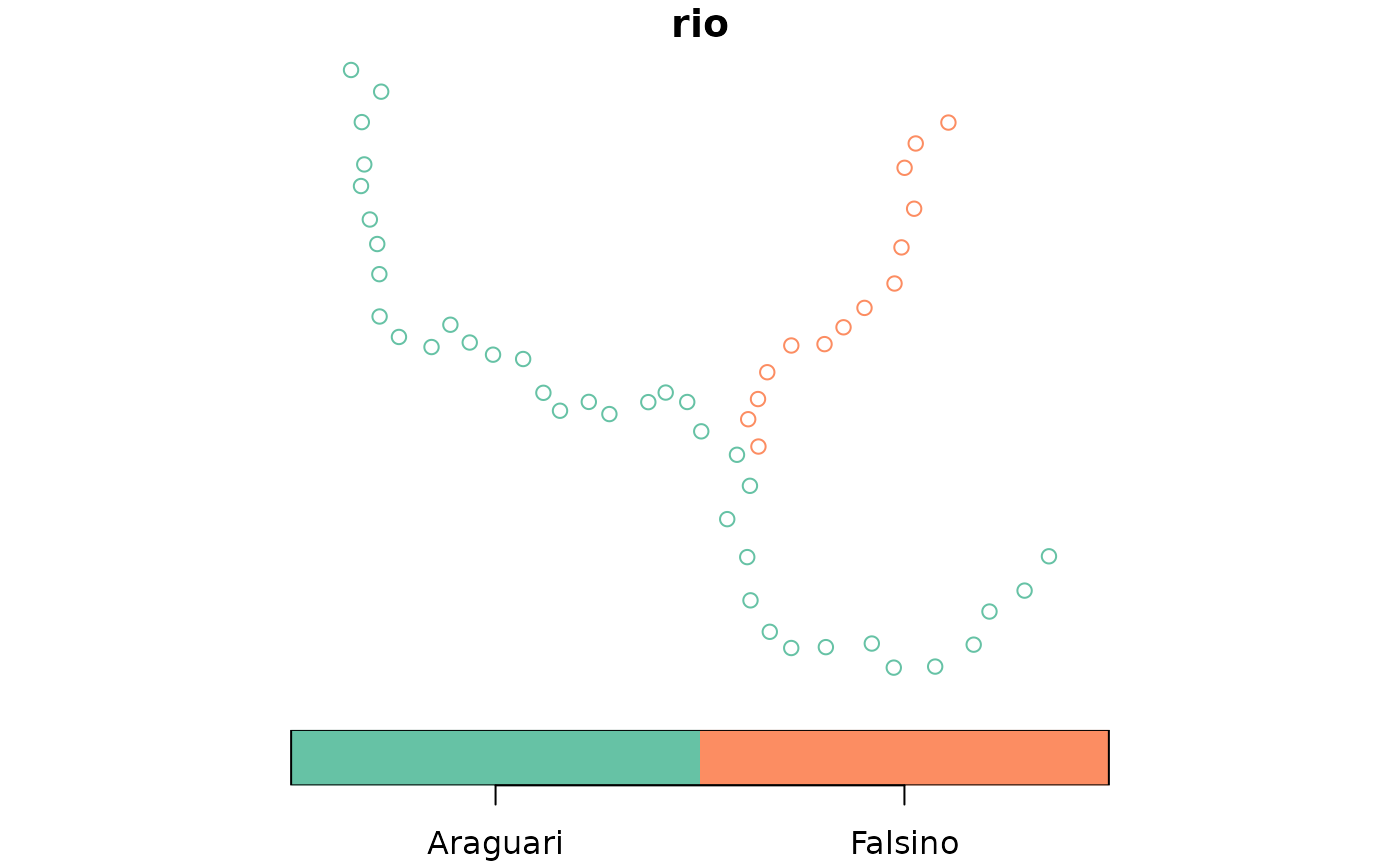
Sample points along rivers.
rio_pontos.RdThe sample points are along centerline of rivers upstream of the Cachoeira Caldeirão Dam. A total of 52 points are regularly spaced at approximately 5 km intervals. Used to develop before-after control-impact analysis of dam impacts on species including Giant Otters (https://doi.org/10.7717/peerj.14287) and Yellow-spotted River Turtles ( https://doi.org/10.1002/aqc.3775).
- location
Amapá, Brazil.
- coord. ref
WGS 84 (EPSG:4326).
Format
`rio_pontos` is sf POINT geometry with 52 points and 8 fields, including:
- subz_id
Unique identifier.
- long
Longitude. Decimal degrees.
- lat
Latitude. Decimal degrees.
- impact
Dam impact. 1 = yes, 0 = no.
Examples
# plot to see the points
plot(rio_pontos["rio"])