Buffers around sample point along rivers.
rio_pontos_buff.RdCircular buffers around a sample point along centerline of rivers upstream of the Cachoeira Caldeirão Dam. A total of 7 buffers with different radii.
- location
Amapá, Brazil.
- coord. ref
WGS 84 (EPSG:4326).
Format
`rio_pontos_buff` is sf POLYGON geometry with 7 polygons and 9 fields, including:
- subz_id
Unique identifier.
- long
Longitude. Decimal degrees.
- lat
Latitude. Decimal degrees.
- impact
Dam impact. 1 = yes, 0 = no.
- raio
Radius around point in meters.
Examples
# plot to see the points
plot(rio_pontos_buff["raio"])
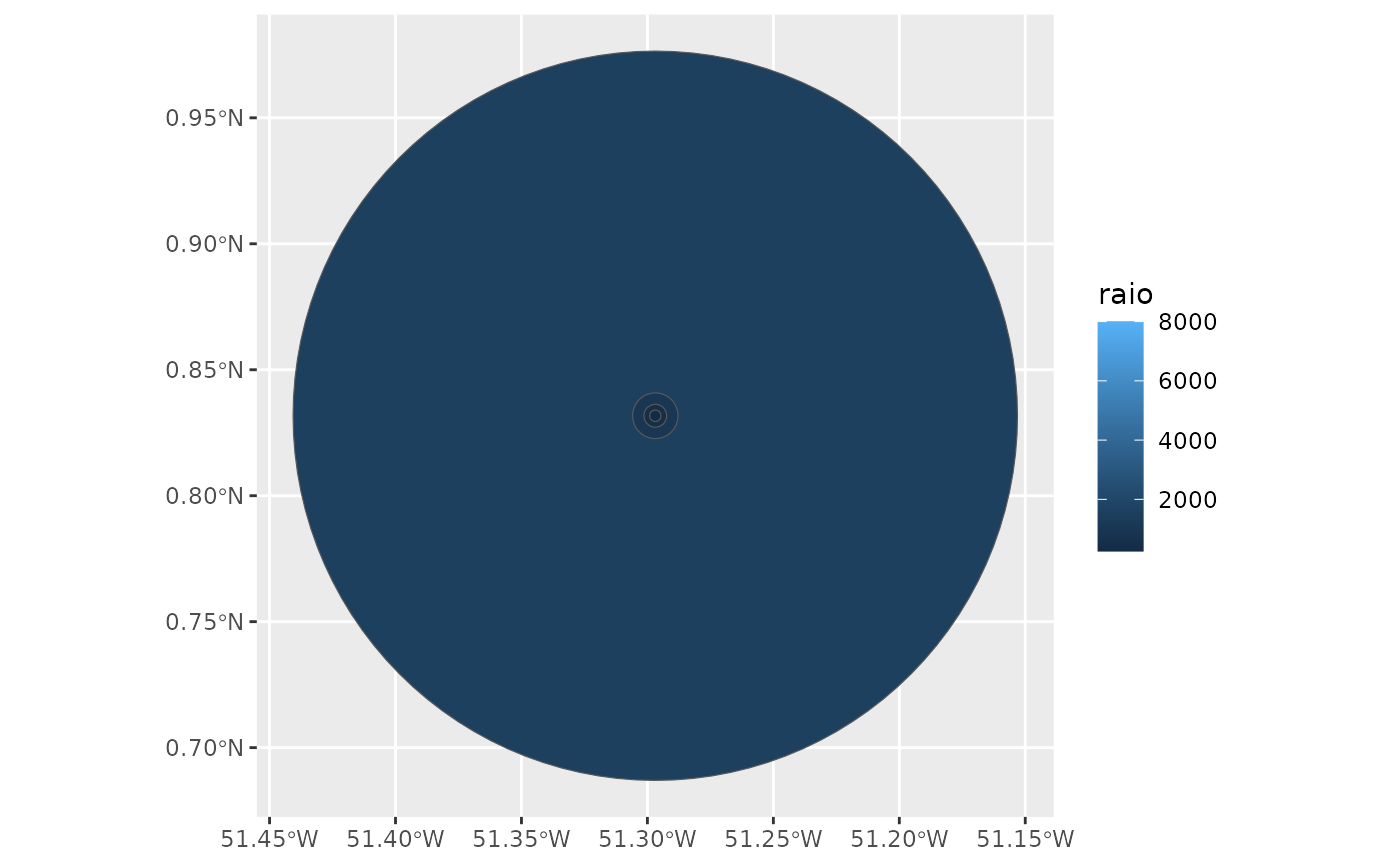
 # visualize overlapping buffers with ggplot2
library(ggplot2)
rio_pontos_buff |>
# Arrange according to radius attribute in descending order
dplyr::arrange(desc(raio)) |>
# Make ggplot and set fill color to radius
ggplot(aes(fill = raio)) +
geom_sf()
# visualize overlapping buffers with ggplot2
library(ggplot2)
rio_pontos_buff |>
# Arrange according to radius attribute in descending order
dplyr::arrange(desc(raio)) |>
# Make ggplot and set fill color to radius
ggplot(aes(fill = raio)) +
geom_sf()